Field Visualizations
Léon olde Scholtenhuis
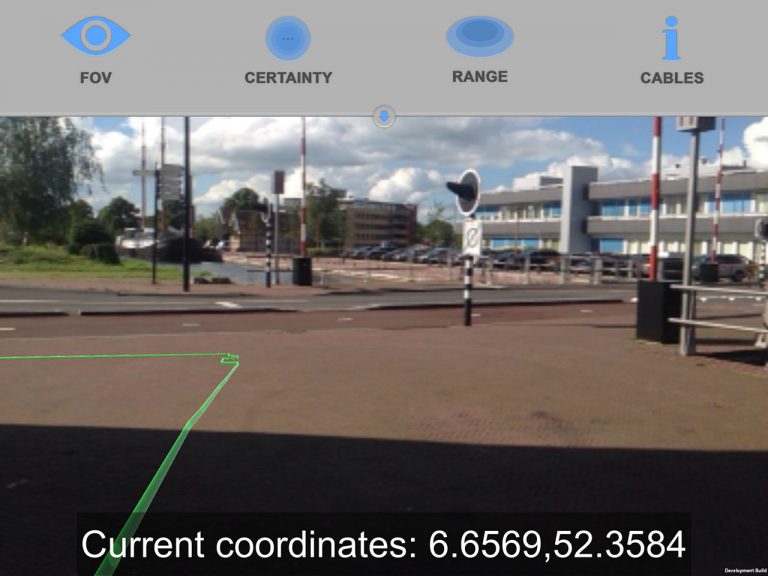
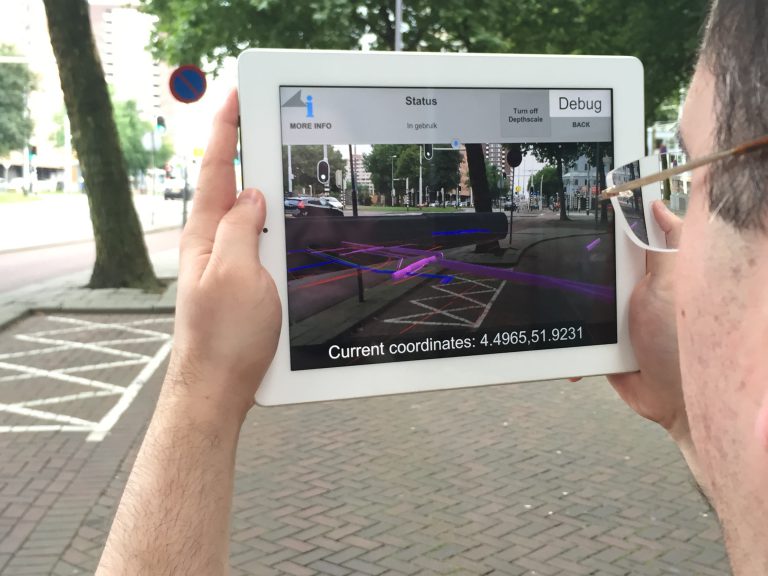
We decided to use augmented reality to (fuzzy) visualize the georeferenced location of underground cables and pipes using a tablet computer. In the last months we have informed Recognize about what we want to see and the way want to see it. We are still developing, but the figures below depict the first in-app results.

Colouring of pipes based on IMKL format
Some utilities are intersecting due the fact we enlarged the size of the pipes and cables in the fuzzy visualisation


The fuzzy visualizations in this first prototype could be improved. At the moment, the fuzzy layer is visualized as if it is a small, medium or large cylinder shaped buffer around a location. The location itself is fixed. This is, however, not in line with the philosophy to have different location parameters (estimated, standard, and surveyed). The next version will therefore first calculate the location based on three location attributes. The weighed arithmetic average of these locations will determine the "fuzzy location". The fuzzy shape will subsequently be calculated based on the largest difference between the mid-point of the "fuzzy location" and "est/std/surveyed" locations.


The prototype is ready for now. It has been tested for the Oostplein location Rotterdam and at the University of Twente Campus Enschede. The SpyingAR app can be downloaded by Using the HockeyApp.
Preliminary findings will be presented at the IWCCE 2017 conference 25-28 june 2017 in Seattle, USA. In brief we conclude:
- Location accuracy of the iPad is insufficient
- Standard, Estimated and Surveyed location seem accurate ways to register uncertainty. All this data is, however, not completely available.
- The weight attributed to each of the location parameters (std, est, sur) is now a static value. In future, a weight function could be developed to more accurately describe the reliability of data.
- Depth visualizations in AR seem complicated. Visual ground level cues may be needed to better show the location and dept of a pipeline/cable.