Contact Us

Use the form on the right to contact us.

You can edit the text in this area, and change where the contact form on the right submits to, by entering edit mode using the modes on the bottom right. 

5 Drienerlolaan
Enschede, Overste, 7522 NB
Netherlands

Zorgvuldige Ondergrondse Aanleg en Reductie Graafschade

Spy Underground

Concluding

Léon olde Scholtenhuis

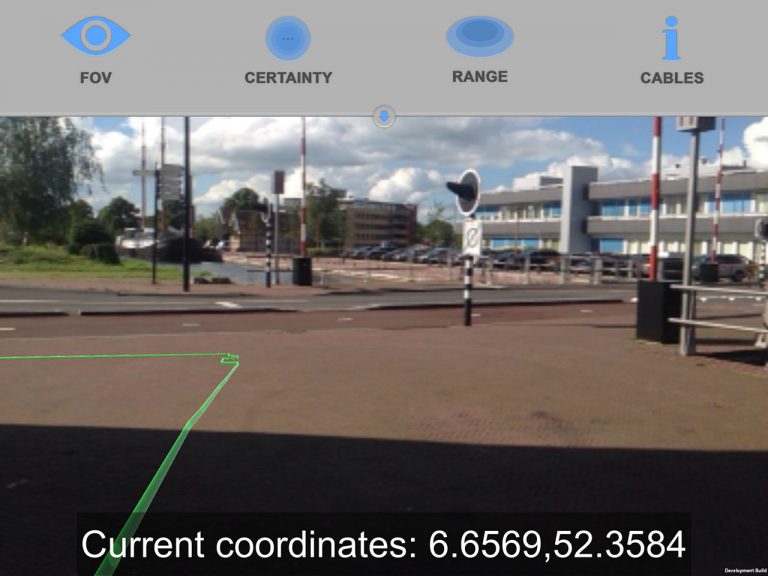
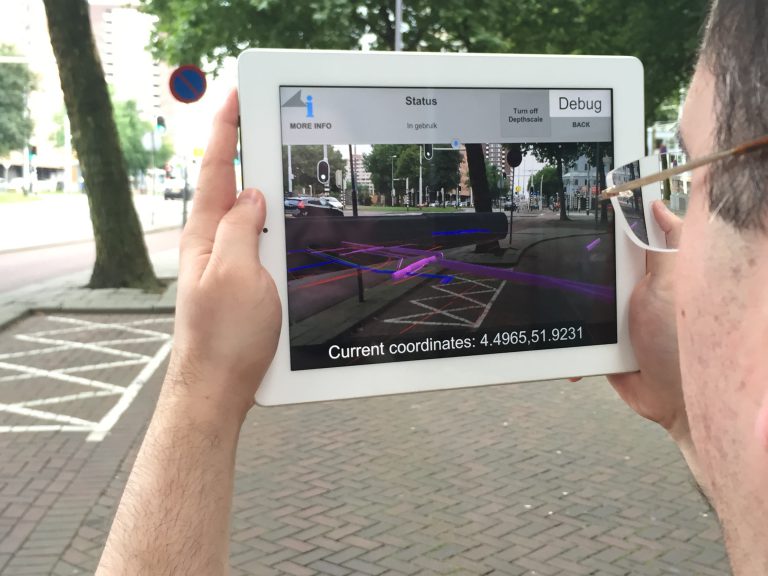
The project finished by March-17, 2017. The prototype was tested later on in Rotterdam (Oostplein and Hoogvliet) and Enschede (University of Twente Campus). With regard to Augmented Reality, the development was done successfully by our partner Recognize. The generation of 3D Fuzzy Shapes based on location data sets with various quality levels (unknown, surveyed, estimated, standard) took place based on our developed extension of the CityGML Utility Network ADE. We mapped existing shape files with FME (safesoft) and used FZKViewer for visualization.

The project resulted into a conference publication at the International Workshop for Computing in Civil Engineering, Seattle USA:

olde Scholtenhuis, L. L., Zlatanova, S., & den Duijn, X. (2017). 3D Approach for Representing Uncertainties of Underground Utility Data. In K-Y. Lin, N. El-Gohary, & P. Tang (Eds.), Computing in Civil Engineering 2017: Information Modeling and Data Analytics (Vol. 2017, pp. 369-376). Seattle, Washington: American Society of Civil Engineers (ASCE).

Furthermore, we showcased the example at various places. A short promotion video can be found on the "Actuele Projecten (Dutch) and Projects (English) pages": Link (English)and Link (Dutch).

We again gratefully acknowledge the support from 4TU.Bouw (sponsor), Municipality of Rotterdam and Recognize in executing this study.

1a3b5a01027f25000039aa3a03103c0b002b2946020701c32c01760080.png

Field Visualizations

Léon olde Scholtenhuis

We decided to use augmented reality to (fuzzy) visualize the georeferenced location of underground cables and pipes using a tablet computer. In the last months we have informed Recognize about what we want to see and the way want to see it. We are still developing, but the figures below depict the first in-app results.

Colouring of pipes based on IMKL format

Colouring of pipes based on IMKL format

Some utilities are intersecting due the fact we enlarged the size of the pipes and cables in the fuzzy visualisation

The fuzzy visualizations in this first prototype could be improved. At the moment, the fuzzy layer is visualized as if it is a small, medium or large cylinder shaped buffer around a location. The location itself is fixed. This is, however, not in line with the philosophy to have different location parameters (estimated, standard, and surveyed). The next version will therefore first calculate the location based on three location attributes. The weighed arithmetic average of these locations will determine the "fuzzy location". The fuzzy shape will subsequently be calculated based on the largest difference between the mid-point of the "fuzzy location" and "est/std/surveyed" locations.

The prototype is ready for now. It has been tested for the Oostplein location Rotterdam and at the University of Twente Campus Enschede. The SpyingAR app can be downloaded by Using the HockeyApp.

Preliminary findings will be presented at the IWCCE 2017 conference 25-28 june 2017 in Seattle, USA. In brief we conclude:

  • Location accuracy of the iPad is insufficient
  • Standard, Estimated and Surveyed location seem accurate ways to register uncertainty. All this data is, however, not completely available.
  • The weight attributed to each of the location parameters (std, est, sur) is now a static value. In future, a weight function could be developed to more accurately describe the reliability of data.
  • Depth visualizations in AR seem complicated. Visual ground level cues may be needed to better show the location and dept of a pipeline/cable.

Visualization Concept

Léon olde Scholtenhuis

To visualize different types of depth, we developed a first visualization concept. Transparency is used to give the user a feeling of depth. A pipe or cable that is constructed close to the ground surface will be less transparent than a pipe or cable that is constructed far below ground level. Additionally, a straight line, with ticks at a fixed distance, will help the user to understand at what depth the pipe or cable is located.

Location Uncertainty

Léon olde Scholtenhuis

We are doing a research on how to visualize the varying levels of certainty of the underground utility location information. For this we had to find out what could cause an inaccurate 3D location. As a result of several meetings with the municipality of Rotterdam, we can distinguish the following situations:

  • The location of the utilities is mapped using a 2D map (that does not include a z-component). In this case the depth of the cable or pipe is estimated. Since 2010 surveyors have to measure the z-coordinate of the utility (next to the x,y-coordinates)
  • The location of the utilities is mapped using their relative location.
  • The location of the utilities is mapped after it is burried (using GPS)
  • The location of the utilities is mapped using an GPS device that comes with an inaccuracy (+/- 5 cm).
  • The utilities are moving over the years (swimming pipes and cables). Most of the movement will be vertically.
  • The actual ground is moving. Data has shown that the ground on the Oostplein is sinking 0 to a almost 1 cm a year. It is unsure whether the subsurface utilities are making the same movement as the above ground.
Sewer line location shown differently by two data sets

Sewer line location shown differently by two data sets

The figure above makes a comparison between two different data sets. The black line represent a profile, in which every pipe or cable is measured. The dot with number 502 is a sewage pipe. The orange line, which is the other data set, represents the exact same sewage pipe. You can see that the location is different.

The uncertain location of the underground infrastructure is a problem that people are facing all over the world. Utility companies in Manhattan mark the location of the pipes and cables on the street (see figure below).

tility companies in Manhattan mark the uncertain location of the pipes and cables on the streets

tility companies in Manhattan mark the uncertain location of the pipes and cables on the streets

With the information and datasets we got from the Rotterdam, we can say that the 3D location of the subsurface utilities is depending on many factors and therefore uncertain. When looking at the depth of a pipe or cable, it could be located:

  • at the measured depth (unfortunately it is not measured in most cases)
  • at the estimated depth
  • at the standard depth (Rotterdam has their own standard)
  • a few cm up/down due subsurface ground movement
  • a few cm up/down due inaccurate GPS measuring

Project Plan

Léon olde Scholtenhuis

Project duration: Jan 2016 - Mar 2017

Project team:

Xander den Duijn – MSc. Student Geomatics for the Built Environment (TU Delft)

Anna-Maria Ntarladima – MSc. Student Geomatics for the Built Environment (TU Delft)

Vangelis Theocharous – MSc. Student Geomatics for the Built Environment (TU Delft)

Dr. Ir. Léon olde Scholtenhuis (University of Twente)

Dr. Ir. Sisi Zlatanova (TU Delft)

In collaboration with:

Municipality of Rotterdam, Recognize B.V., 

Acknowledgements:

Ir. Paul de Ruiter – Design Informatics (TU Delft)

Description:

The ambition of this project is to provide a solution to the varying levels of certainty of underground utility location information. To date, this ambiguity hampered registration of most 3D coordinates on maps. We therefore aim to extend 2D-CAD utility maps (KLIC-melding) with fuzzy 3D information about depth- and geometry of utilities, to achieve an enriched 3D view on the subsurface.

2D and 3D (fuzzy) visualisations of subsurface utilities

2D and 3D (fuzzy) visualisations of subsurface utilities

This information can include, for example, estimated depths; standard depths; and, actually measured depths . Figure 1 b & c visualize the anticipated product. To ensure that the model can be used by a broad group of users in the field, we have selected some Augmented Reality tools. These tools will be used to test the fuzzy visualization. The tangible deliverable of this study is therefore twofold: a framework to create a ‘fuzzy 3D map’ and a prototype advanced visualization environment, i.e. an Ipad application. When the concept has been proven successfully, we expect the tool to support site exploration, construction planning, and maintenance. The contractors can use the method and upscale the implementation of Augmented Reality with fuzzy 3D maps to support their work processes, and to teach residents and Civil Engineering students about the complexity of existing subsurface networks.